机器学习之分类
• k-means实现客户分类
k-means实现客户分类
採用机器学习中的k-means
利用数据: 美国加州大学公开的批发商的客户数据
第1列: 销售渠道(Channel ※不使用)
第2列: 客户的区域(Region ※不使用)
第3列: 鲜货的年订购量(Fresh)
第4列: 奶类的年订购量(Milk)
第5列: 杂货的年订购量(Grocery)
第6列: 冷冻食品的年订购量(Frozen)
第7列: 卫生用品、纸张的年订购量(Detergents_Paper)
第8列: 熟食类的年订购量(Delicassen)
编程代码(Python):
import pandas as pd
import numpy as np
from sklearn.cluster import KMeans
import matplotlib.pyplot as plt
df_read = pd.read_csv('Wholesale_customers_data.csv') #读取数据
cust_df = df_read.copy()
#删除不要的列
del (cust_df['Channel'])
del (cust_df['Region'])
cust_array = np.array([cust_df['Fresh'].tolist(),
cust_df['Milk'].tolist(),
cust_df['Grocery'].tolist(),
cust_df['Frozen'].tolist(),
cust_df['Detergents_Paper'].tolist(),
cust_df['Delicassen'].tolist()],
np.int32)
cust_array = cust_array.T
k = 3
labels = KMeans(n_clusters=k, random_state=0).fit_predict(cust_array) #进行预测
df_read['cluster'] = labels #结果追加在最后
pd.DataFrame.to_excel(df_read,'c:/kmeans_result.xlsx',index=False) #结果保存
cust_df['cluster'] = labels
print('---簇的计数---')
print(cust_df['cluster'].value_counts())
for i in range(k):
print('---簇{}的平均---'.format(str(i)))
print(cust_df[cust_df['cluster'] == i].mean())
#可视化
clusterinf = pd.DataFrame()
for i in range(k):
clusterinf['cluster' + str(i)] = cust_df[cust_df['cluster'] == i].mean()
clusterinf = clusterinf.drop('cluster')
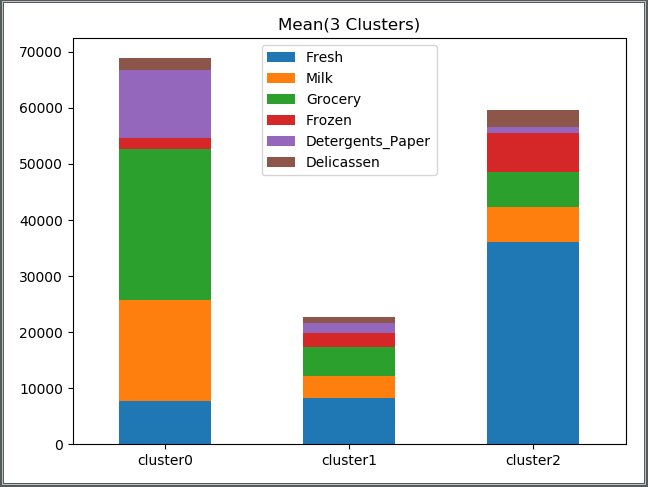
clustersInf = "Mean({} Clusters)".format(str(k))
clus_plot = clusterinf.T.plot(kind='bar', stacked=True, title=clustersInf )
clus_plot.set_xticklabels(clus_plot.xaxis.get_majorticklabels(), rotation=0)
plt.show()
---簇的计数---
1 328
2 59
0 53
Name: cluster, dtype: int64
---簇0的平均---
Fresh 7751.981132
Milk 17910.509434
Grocery 27037.905660
Frozen 1970.943396
Detergents_Paper 12104.867925
Delicassen 2185.735849
cluster 0.000000
dtype: float64
---簇1的平均---
Fresh 8341.612805
Milk 3779.893293
Grocery 5152.173780
Frozen 2577.237805
Detergents_Paper 1720.573171
Delicassen 1136.542683
cluster 1.000000
dtype: float64
---簇2的平均---
Fresh 36156.389831
Milk 6123.644068
Grocery 6366.779661
Frozen 6811.118644
Detergents_Paper 1050.016949
Delicassen 3090.050847
cluster 2.000000
dtype: float64
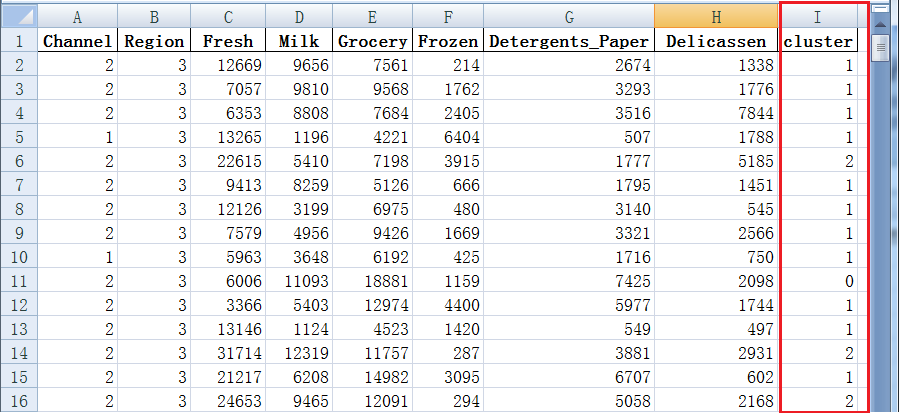
Excel表格(I列为求出的各顾客的所处簇)
顾客被分成3簇
簇1(cluster1)有328人
簇2(cluster2)有59人
簇0(cluster0)有53人
从图中可以看到被分到簇1(cluster1)的顾客(328人) 整体订购量很低(人数最多)
订购量较高的是被分到簇2(cluster2)的顾客(59人)与被分到簇0(cluster0)的顾客(53人)
被分到簇2(cluster2)的顾客(59人)的特点为订购鲜货量较高
被分到簇0(cluster0)的顾客(53人)的特点为各种订购量比较平均(杂货稍微多点)
k-means可用于数据分类
(在医学上应该可用于基因分类等)
预先知道顾客的聚类数(簇)k那最好,如果不知道,可利用手肘法来选取最佳簇数(虽然手肘法不是一个完美的方法)
具体做法是让k从1开始取值直到合适的上限(这里选取上限为19),
对每一个k值进行聚类并记下对应的distortion,然后描绘k与distortion的关系图,最后选取肘部对应的k(弯曲点)作为最佳簇数。
执行以下的代码可得下面的关系图
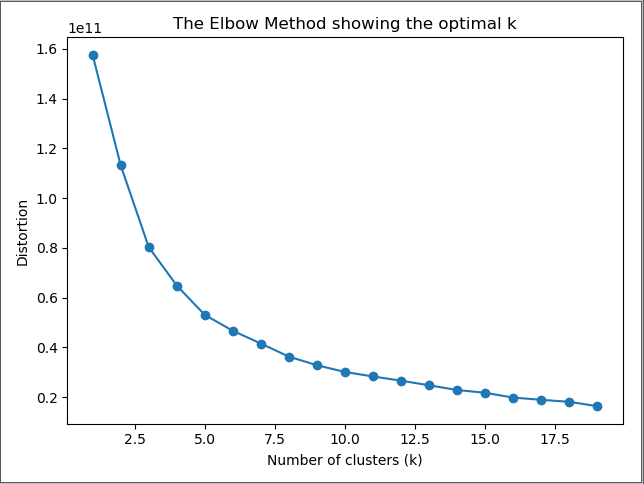
从图中可以看出出现弯曲点为K=3的位置(X轴)所以上面例中簇数选3
用手肘法选取最佳簇数python代码:
from sklearn.cluster import KMeans
import matplotlib.pyplot as plt
import pandas as pd

X = pd.read_csv("Wholesale_customers_data.csv")
del (X['Channel'])
del (X['Region'])
X = X.values

# k means determine k
distortions = []  # 存放每次结果的误差平方和
clusters = range(1, 20)
for k in clusters:
    km = KMeans(n_clusters=k).fit(X)
    distortions.append(km.inertia_)

# Plot the elbow
plt.plot(clusters, distortions, marker='o')
plt.xlabel('Number of clusters (k)')
plt.ylabel('Distortion')
plt.title('The Elbow Method showing the optimal k')
plt.show()